
- Published on
【Systems Thinking】Why has Mercari accelerated its growth?
In a nutshell
- Causal loop diagrams of systems thinking can be applied to business model analysis.
- The increase in Mercari's buyers and sellers is driven by a clever self-reinforcing loop.
- Mercari's growth loop is likely to become a perpetual motion machine. It reminds me of Amazon's growth loop.
Business model analysis using causal loop diagrams
It's been a while since I've done systems thinking. I'm sure you've all forgotten, but I'm hooked on systems thinking and have recently been working on quantitative modeling.
Why am I hooked? Because by modeling the butterfly effect, which I had only vaguely felt before, I can notice various hidden facts, and it's very interesting.
The butterfly effect is a phenomenon known in Japan by the proverb "When the wind blows, the coopers prosper," and it refers to a phenomenon in which a very small event gradually causes a ridiculously large phenomenon. Why is it called the butterfly effect? It comes from the common belief that if a butterfly flaps its wings in Brazil, it will cause a tornado in Texas.
Causal loop diagrams are actually very effective for business model analysis. This is because people often make business decisions without fully analyzing the effects and side effects of things, and while they can perform element analysis using logical thinking, they are almost always unable to perform inter-element analysis using systems thinking. I think the effect will be manifested simply because you can "go above and beyond the average person (in the style of Paul Graham)." 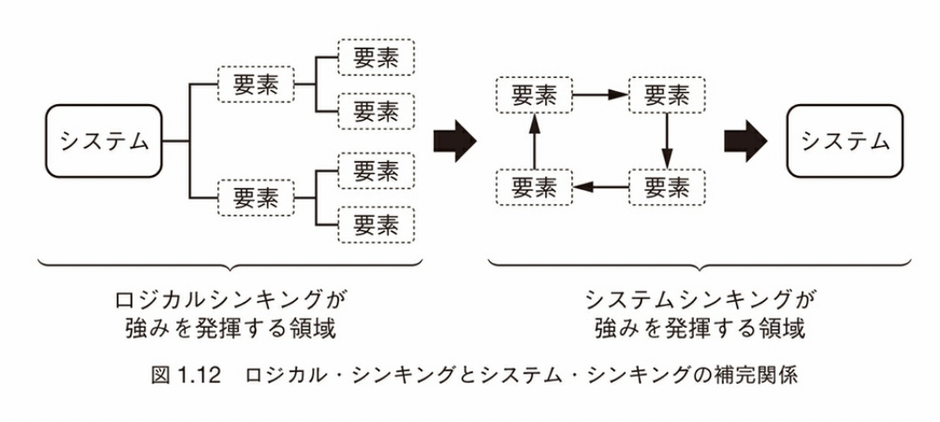
From Practical Systems Thinking (Nobuaki Minato/KS Engineering Specialized Book)
For readers who are not familiar with causal loop diagrams, I would like you to read my past articles before returning to this article. I think you will have a better understanding of the meaning of the Mercari causal loop diagram below. 【Systems Thinking】Why do we drink too much? Why is traffic congestion not solved? 【Systems Thinking】Why do people who are a little good at their jobs quit?
Modeling the effect of increasing Mercari's buyers and sellers
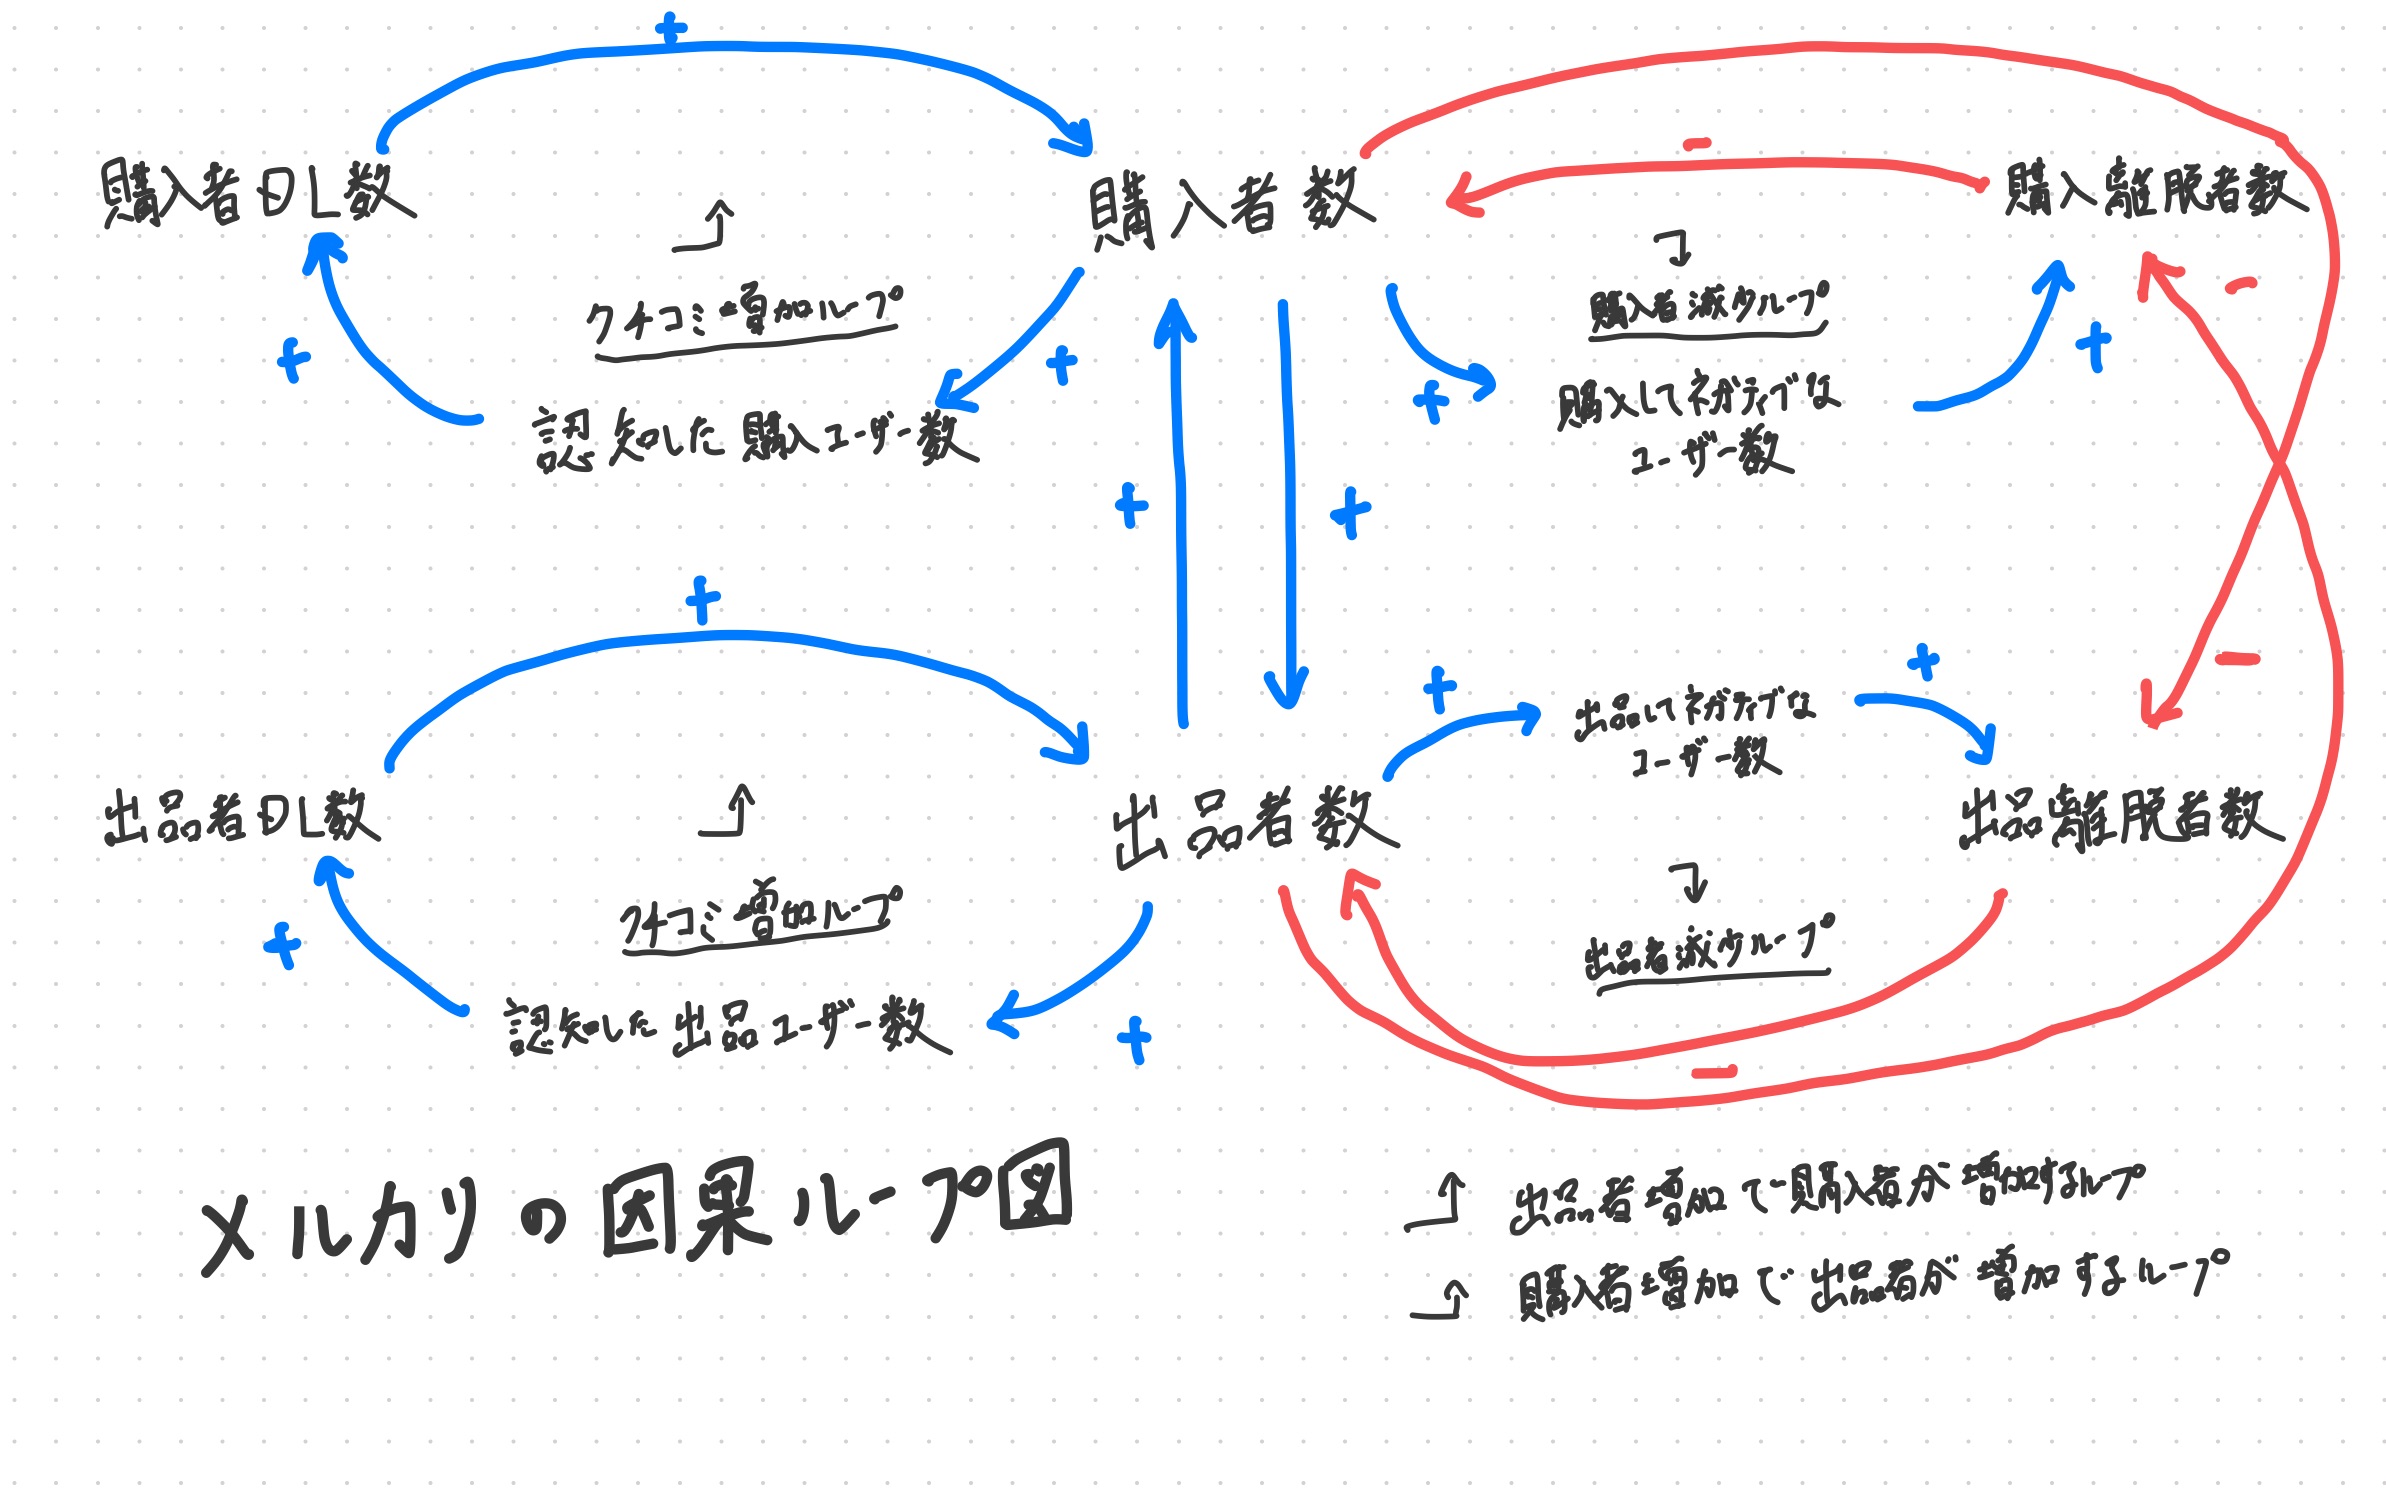
So, the following is a causal loop diagram that expresses Mercari's growth.
In economic terms, it's a story that is often dismissed with the single phrase, "It's a network effect," but with systems thinking, you can accurately represent the structure. To be honest, it took a while, lol.
The network effect refers to the effect that the value of a product or service is determined by the number of users associated with it, so the more users there are, the higher the value. In the case of a flea market app, the more buyers and sellers there are, the more the value increases synergistically.
First, let's explain the elements.
| Element Name | Description |
|---|---|
| Number of buyer downloads | The number of people who plan to buy something and have downloaded Mercari |
| Number of buyers | The number of people who buy things |
| Number of buyer drop-offs | The number of people who have stopped buying things |
| Number of recognized buyer users | The number of people who are thinking of downloading Mercari because they heard about it from a buyer's word-of-mouth |
| Number of users who had a negative experience as a buyer | The number of people who ended up not buying anything or who had a bad impression of Mercari after buying something |
| Number of seller downloads | The number of people who plan to sell something and have downloaded Mercari |
| Number of sellers | The number of people who sell things |
| Number of seller drop-offs | The number of people who have stopped selling things |
| Number of recognized seller users | The number of people who are thinking of downloading Mercari because they heard about it from a buyer's word-of-mouth |
| Number of users who had a negative experience as a seller | The number of people who ended up not selling anything or who had a bad impression of Mercari after selling something |
Next, the following conditions are not considered.
- The quality of the listed products is not considered.
- The conversion of sellers to buyers and buyers to sellers is not considered.
- The possibility of using or using other apps at the same time is not considered.
Below, I will explain the four loop structures (self-reinforcing loops) obtained by modeling.
Buyer/seller word-of-mouth increase loop (the two loops on the left side of the diagram)
This refers to the loop of Number of buyer downloads → Number of buyers → Number of recognized buyer users → Number of buyer downloads and the loop of Number of seller downloads → Number of sellers → Number of recognized seller users → Number of seller downloads. 
- As the [Number of buyer downloads/Number of seller downloads] increases, the [Number of buyers/sellers] increases.
- As the [Number of buyers/sellers] increases, the [Number of recognized buyer users/Number of recognized seller users] increases due to word-of-mouth and reputation.
- As the [Number of recognized buyer users/Number of recognized seller users] increases, the [Number of buyers/sellers] increases.
Buyer/seller decrease loop (the two inner loops on the right side of the diagram)
This refers to the loop of Number of buyers → Number of users who had a negative experience as a buyer → Number of buyer drop-offs → Number of buyers and the loop of Number of sellers → Number of users who had a negative experience as a seller → Number of seller drop-offs → Number of sellers. 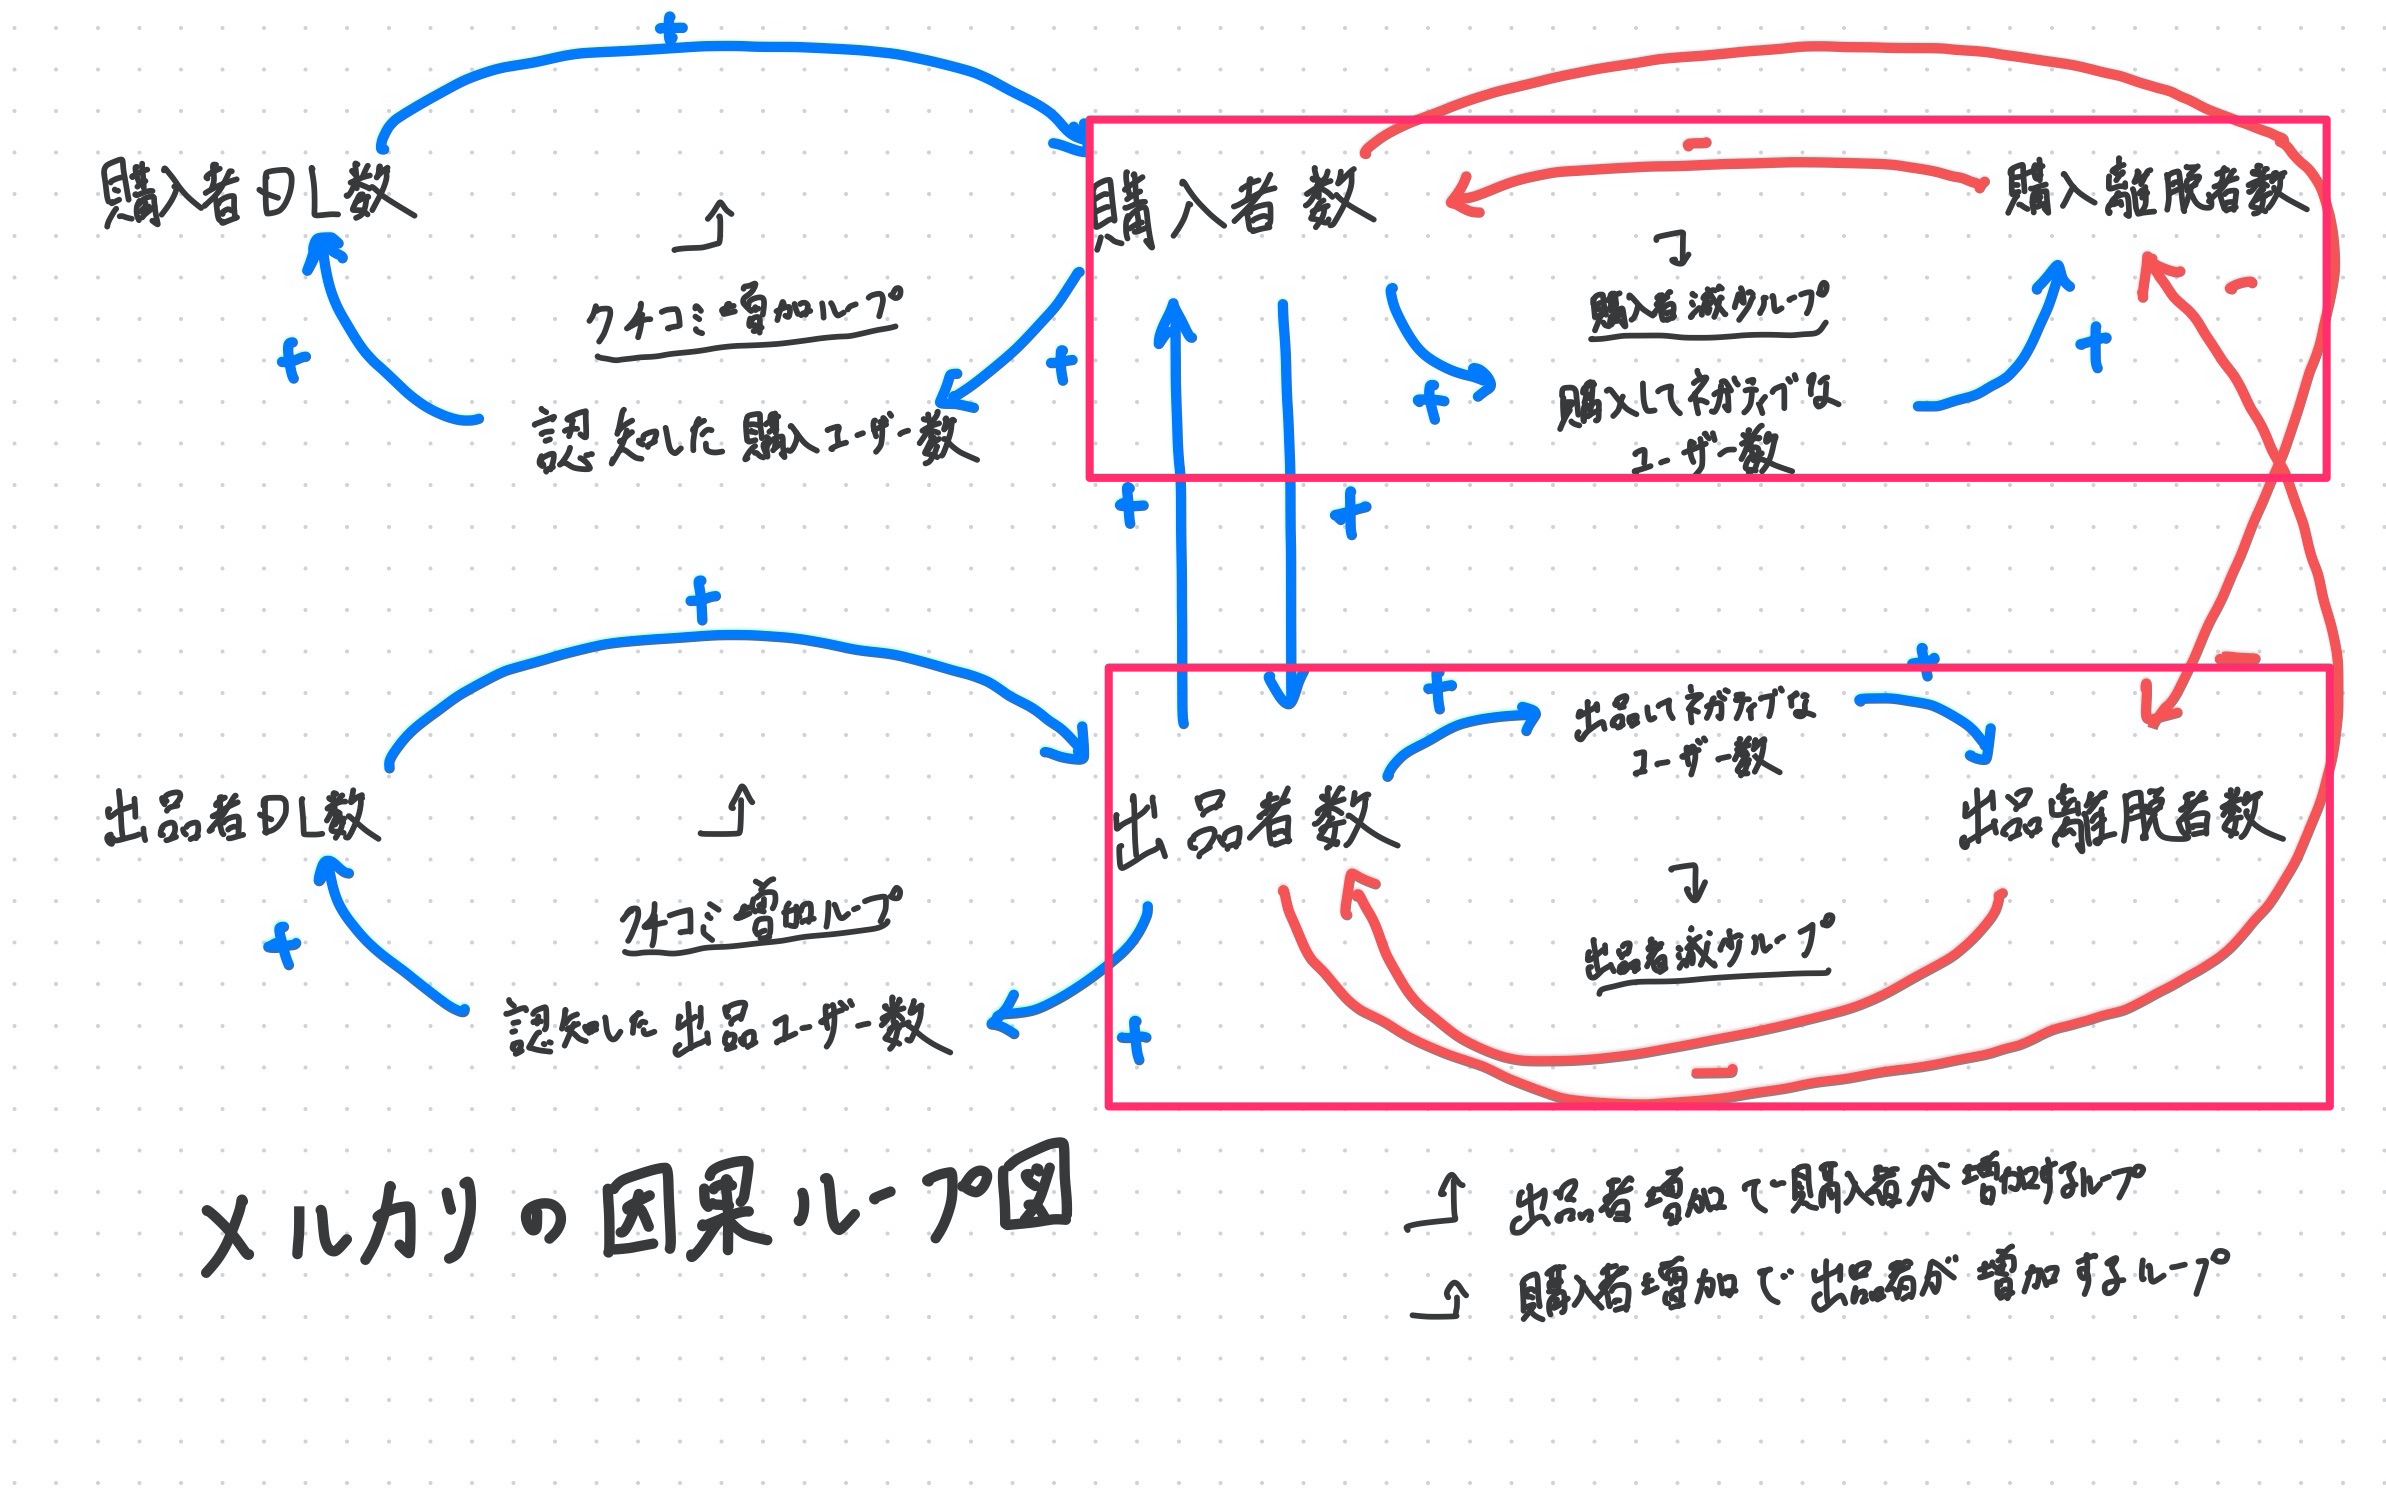
- As the [Number of buyers/sellers] increases, the [Number of users who had a negative experience as a buyer/Number of users who had a negative experience as a seller] increases.
- As the [Number of users who had a negative experience as a buyer/Number of users who had a negative experience as a seller] increases, the [Number of buyer drop-offs/Number of seller drop-offs] increases.
- As the [Number of buyer drop-offs/Number of seller drop-offs] increases, the [Number of buyers/sellers] decreases.
Loop where an increase in sellers leads to an increase in buyers (on the right side of the diagram, network effect)
This refers to the loop of Number of sellers → Number of buyer drop-offs → Number of buyers → Number of sellers. 
- As the [Number of sellers] increases, the number of products to choose from increases, so the [Number of buyer drop-offs] decreases.
- As the [Number of buyer drop-offs] decreases, the [Number of buyers] increases.
- As the [Number of buyers] increases, the probability of a listed product being sold increases, so the [Number of sellers] increases.
Loop where an increase in buyers leads to an increase in sellers (on the right side of the diagram, network effect)
This refers to the loop of Number of buyers → Number of seller drop-offs → Number of sellers → Number of buyers.
- As the [Number of buyers] increases, the probability of a product being sold decreases, so the [Number of seller drop-offs] decreases.
- As the [Number of seller drop-offs] decreases, the [Number of sellers] increases.
- As the [Number of sellers] increases, the number of products to choose from increases, so the [Number of buyers] increases.
Mercari's growth loop is likely to become a perpetual motion machine
Well, looking at Mercari's causal loop diagram, it's clear how much they have valued UX, word-of-mouth, and recognition in order to properly cultivate the self-reinforcing loop.
Can you also see that the business model itself does not need to run a self-reinforcing loop on its own? Since there is no loop that is turned by increasing elements through sales, once it enters the growth loop, it will grow successfully.
In other words, Mercari's growth loop is like a perpetual motion machine, and the impact when it is activated is intense.
And then I suddenly realize. It's similar to Amazon's famous growth loop.

Amazon and Renoveru Practice--Customer-Centric Business That Solves Customers' "Worries" (CNET) From
Amazon founder Jeff Bezos drew the above diagram on a restaurant napkin when he started his business, and this became the foundation of Amazon. I apologize for the unknown source, but I have heard a story that Mercari's Shintaro Yamada also drew a growth loop diagram on a restaurant napkin for his investor at the time, Fumiaki Koizumi. I wonder if the growth loop diagram he drew at that time was the loop diagram that I created.
Aside (Recommended Book)
A recommended design book. It's packed with design tips that you can use forever. I use it often myself.
