
- Published on
[System Thinking] A collection of curved patterns that the world tends to conform to

Roughly speaking
- System thinking was also useful in the COVID-19 pandemic. The reason is that you can predict the number of infected people in one month.
- A collection of curve patterns that the world tends to conform to.
- Knowing the curve will prevent you from being overwhelmed by unexpected facts. Because you can predict and take action in advance.
COVID-19 infections were predictable
The COVID-19 pandemic has begun to spread in the third wave, but since the curve pattern is known up to the second wave, it is likely that some predictions are possible.
Corona can be statistically inferred unless daily data is tampered with. The infection will not be able to land by the end of May. This was something that quantitative policy scholar Takahashi Yoichi had already predicted using existing data.

The above was calculated, but there is no need to perform any calculations. When people with system thinking skills obtain certain information, they intuitively form models in their heads, allowing them to make some estimation.
A collection of curved patterns that the world tends to conquer
In system thinking, the effects between elements are seen by drawing a causal loop diagram, but the results that the loop produces are modeled as curved patterns.
If you don't know about system thinking yet, please refer to the article introduced under the tag "System Thinking". Below we will pick out the simplest articles as basics.
System Thinking Why do I drink too much? Why are traffic jams not resolved?
Let's start by introducing some patterns that the world tends to take. Practical System Thinking (Minato Nobuaki/KS Specialized Book of Science and Engineering) shows six.
Exponential Growth
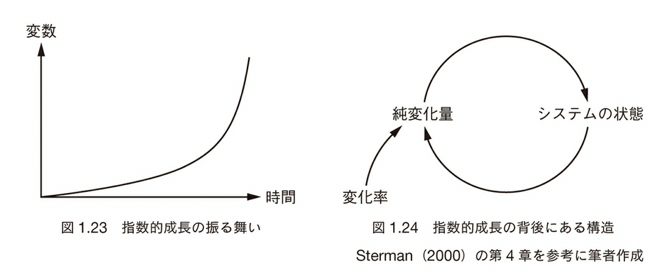
As you can see, this pattern changes accelerating over time. Compound interest is the case.
Pursuing goals

This is a pattern in which there is a target value, and changes converge to the target value over time. Traffic accidents and error rates at factories are typical examples.
vibration

A pattern where the target value increases or decreases. This occurs when there is a significant delay in the causal relationship of the system. Causes include delays in measurement, delays in reporting, delays in recognition, delays in decision-making, delays in effectiveness, and more.
Typical examples include inflation rates. Even if central banks such as the Bank of Japan try to adjust by easing monetary and austerity in response to the inflation target, they will continue to vibrate as the effectiveness of the market will be delayed before they can be released in the market.
S-shaped growth

This is the important factor in the concept of shared resources. When considering a certain ecosystem, there is an environmental capacity that is the number of specific types of organisms that can live in their habitat. The environmental capacity is fixed for each land, so the number of populations will converge in a target-purpose manner towards the environmental capacity. Another way to look at it is to see an S-shaped curve such as the cumulative number of infected people, or the monthly sales of a period displayed as a cumulative number. In other words, the total population and sales are considered as environmental capacity and converged to 100. Technological innovation also draws this curve.
Growth with vibration
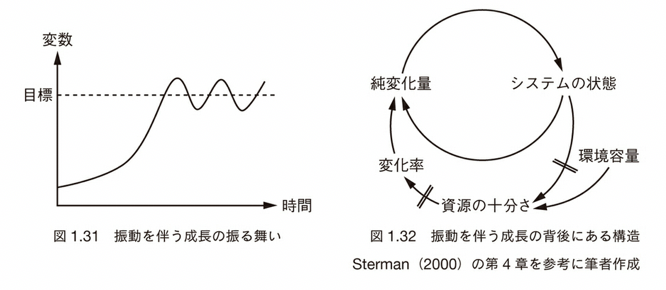
More complicated, this refers to the pattern in which time delays occur in S-shaped growth. It is the type that vibrates when approaching the target. For example, when making hot spring eggs, you need to adjust the stove heat to a temperature of between 60-70 degrees, but even if you're close to the target value, it takes time to measure it, so it's almost too hot and hurry up and reduce the heat. This will cool you down by the air. You will then have to take another time to measure and increase the heat on the stove, but if it is too strong, the yolk will harden and you will have to reduce the heat again. As a result, temperature will result in vibrational growth.
Growth and collapse

This is also complicated, but this refers to a pattern in which the ecosystem itself gradually collapses as environmental capacity is worn down. As a concrete example, consider the catch of tuna. As Japan's population increases, the catch of tuna has increased, but as the total amount of tuna decreases, the total amount of small tuna decreases as an environmental capacity. The catch will then peak, and it will fall into an eggshell state, accelerating the decline in small tuna. Other examples include the population of Gunkanjima (the decline caused by the closure of coal mines) and one-shot comedians (the average person who thinks environmental capacity is interesting to play).
Put your groundwork in advance with future predictions
System thinking is useful when looking at the distant future. When some data comes, I can predict like a prophet, "This will happen six months from now," and "This will happen one year from now."
I myself have used this modeling to roughly predict the number of future coronavirus cases and the food crisis. The coronavirus will spread from the end of November, and from January to February, it will likely be necessary to live a self-restraint that is close to lockdown. The food crisis has already resulted in the result of floods in China, but grain prices will rise in the summer of 2021, and Africa, where purchasing power is relatively weak, will have an increased risk of starvation and not being able to import grain. China is working alone to save food, but it is already not in time.
You can also predict the timing of peak out. The coronavirus peaks out in the summer of 2021 and will likely subside at the end of 2021. Spring 2021 is still not in place. You need to be careful until around the sixth wave.